Datametrix Wallboard Help
1. About Wallboard software
2. Realtime Monitor
3. Queue reports
4. Agent reports
5. Team reports
6. Call (IVR) reports
1. About Wallboard software
Wallboard monitors Cisco Contact Center Enterprise versions 7.x, 8.x and 9.x.Wallboard is a web-based software. It is recommended to use latest versions of modern browsers like FireFox, Chrome, Opera or Internet Explorer 9 or later. Old versions of Internet Explorer are not supported.
Wallboard contains 5 modules: Realtime Status Monitor, Queue Report, Agent Report, Team Report and Call Report. Each module is as a separated tab in main window.
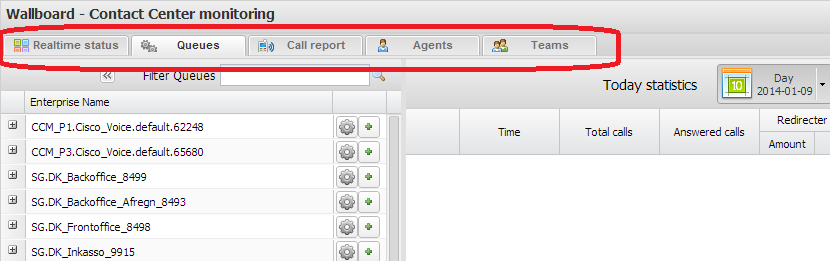
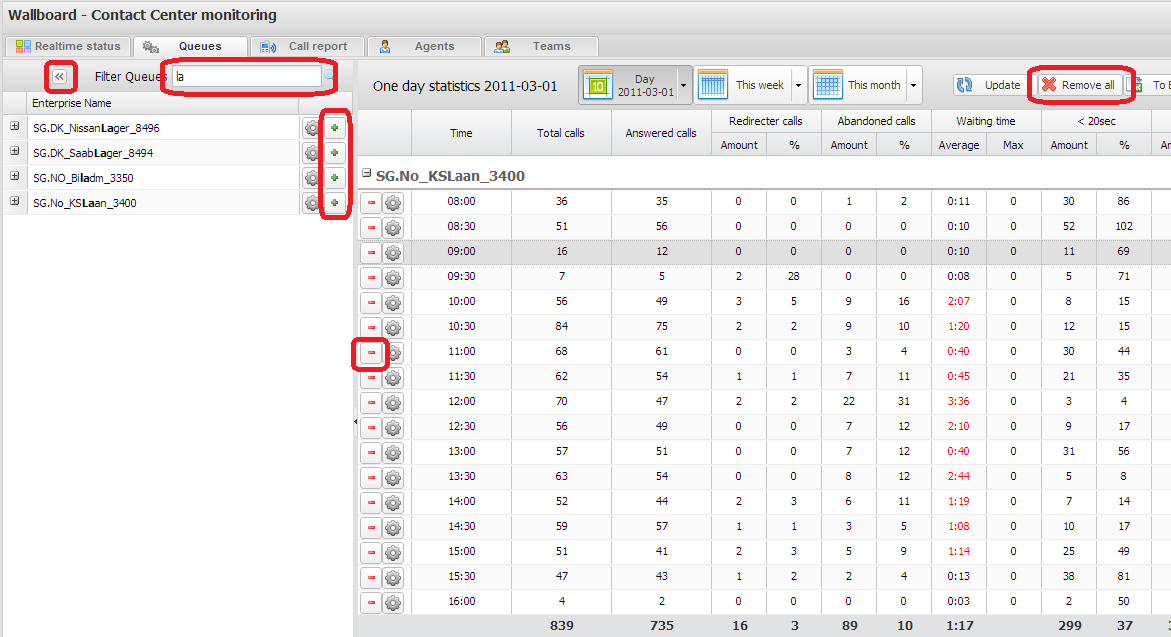
To search through all available Queues, Agents or Teams use search field at the left panel. The search panel can be hidden by [<<] button.
To add Queues, Agents or Teams to report use [+] buttons. To remove items from a report use individual [-] buttons. To remove all items from report use [Remove all] button.
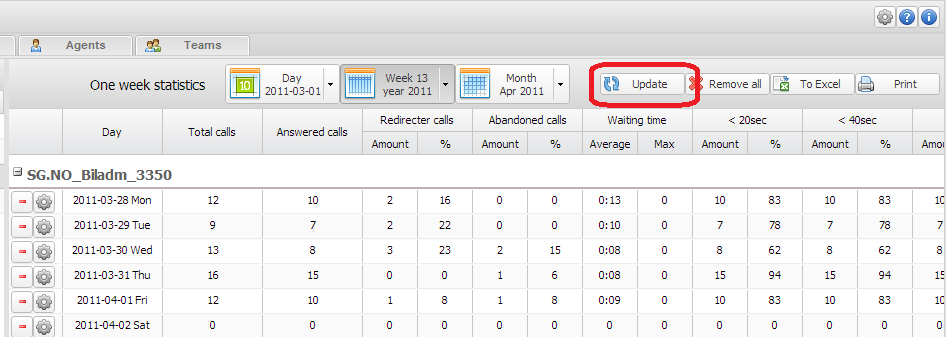
Use special buttons [Day],[Week], [Month] at the top to choose day, week or month for a report.
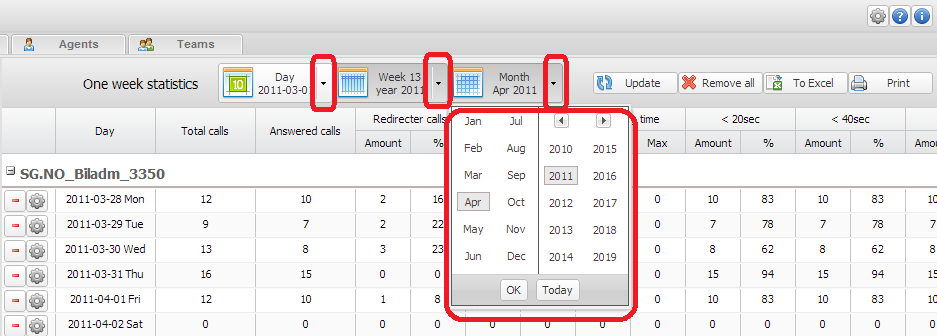
Use [Update] button to update the reports.
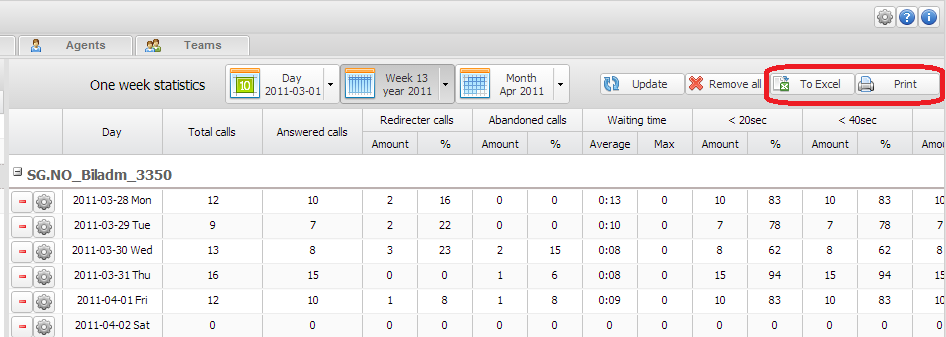
All reports can be exported to Excel (or another compatible software) or can be converted to prient-friendly view.
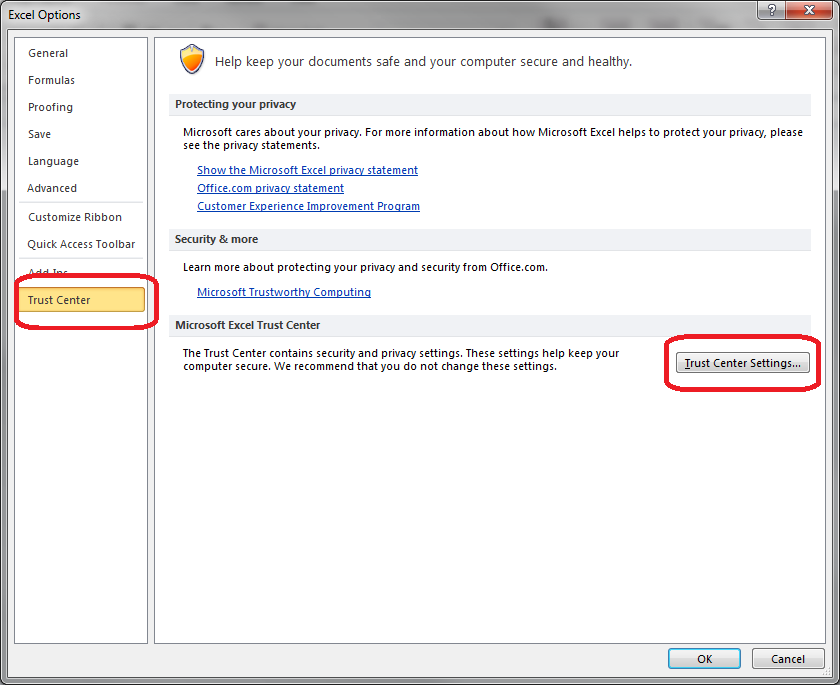
Note! If you use Micorsoft Excel 2010 it can be not possible to download files from untrusted locations by default. To fix this problem open Excel options menu and choose "Trust Center".
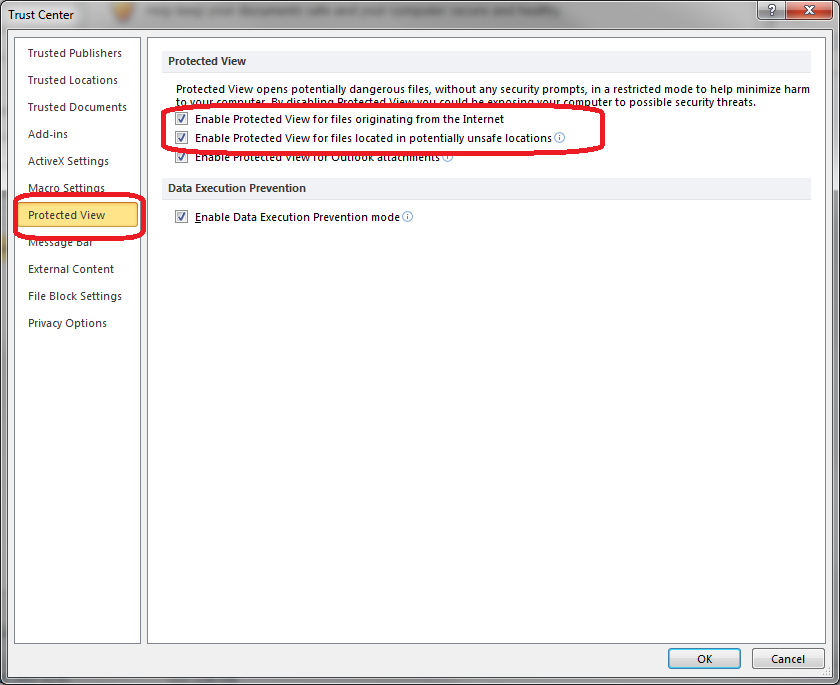
Then go to "Trust Center Settings..." menu and choose "Protected View". Check options "Enable Proteced View for files originating from the Internet" and "Enable Protected View for files located in potentially unsafe locations" there.
2. Realtime Monitor
Monitor shows current state of Contact Center's queues. Data is automatically updated every 15 seconds. Use [Update] button to update data manually. Use [Pause] button to temporary pause automatically updates.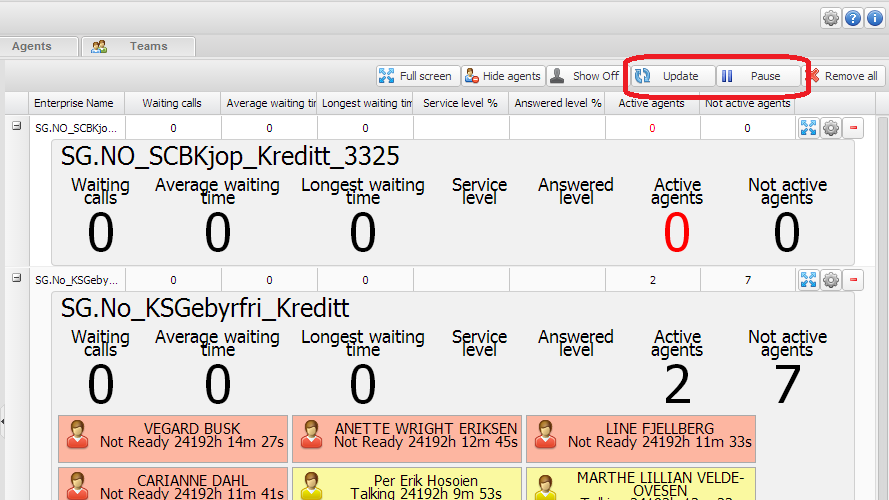
The following data is avaialable:
- Waiting calls - current number calls waiting in the current queue
- Average waiting time - average wating time in minutes:seconds calls spend in the queue for a day
- Longest waiting time - current longest wating time in minutes:seconds calls spend in the queue. If there are no calls in the queue (Waiting calls=0) then this value is 0.
- Service level % - relative number of calls that were answered within X seconds. Service level can be configured either generally for all groups or individually for a group.
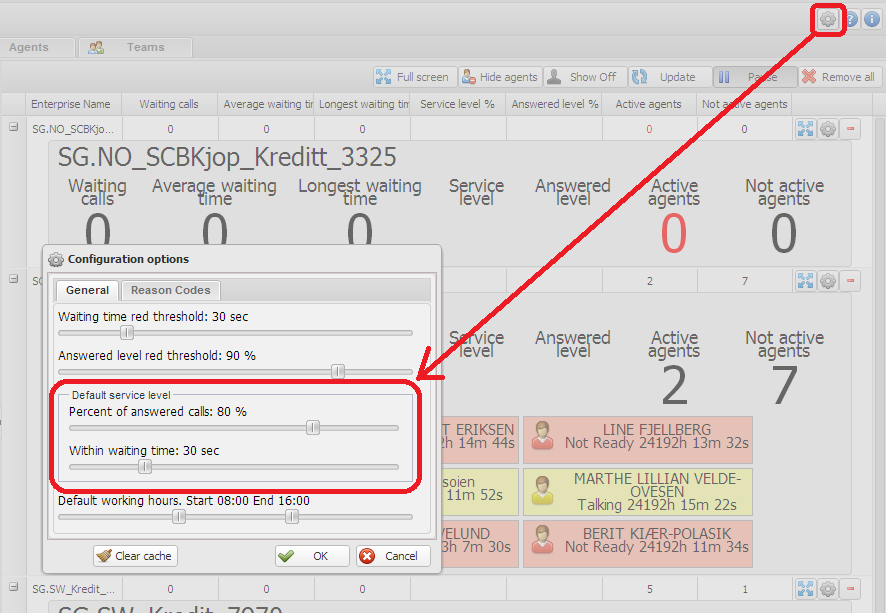
Default configuration is available at general Wallboard Configuration Options dialog window.
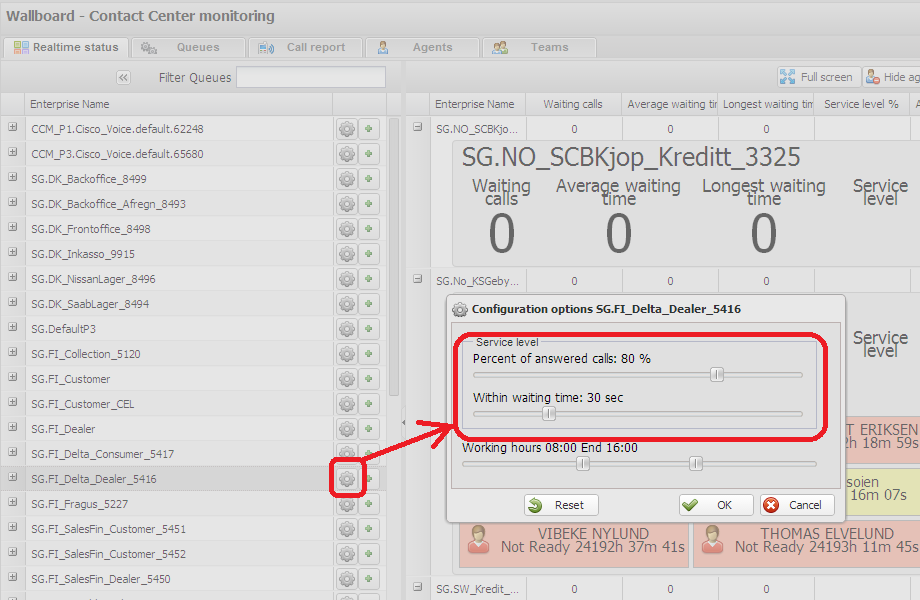
Individual service level configuration is available for every Queue. Use individual config buttons at every Queue to open individual config window.
"Percent of answered calls" slider sets the red threshold for service level. Service level higher then this percent will be shown in the monitor in green color. Service level lower then this percent will be shown in red. "Within wating time" slider sets number of seconds to measure service level.
- Answered level % - relation between answered calls and total number of calls. The following formula is in use: Answered_level_% = (Total_Calls - Abandoned_Calls_In_Service_Level_5sec)*100% / Abandoned_Calls.
Use [Full Screen] buttons to open monitor for full screen.

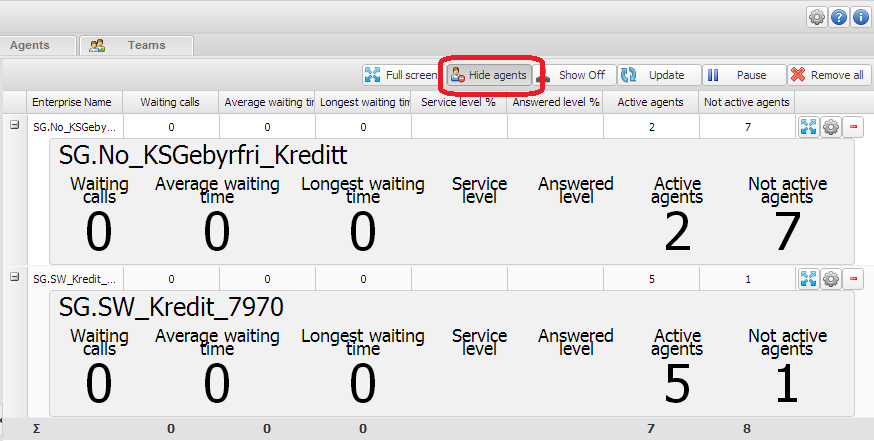
Full Screen mode has a special [Summary] button to show only summary data for all monitored Queues.
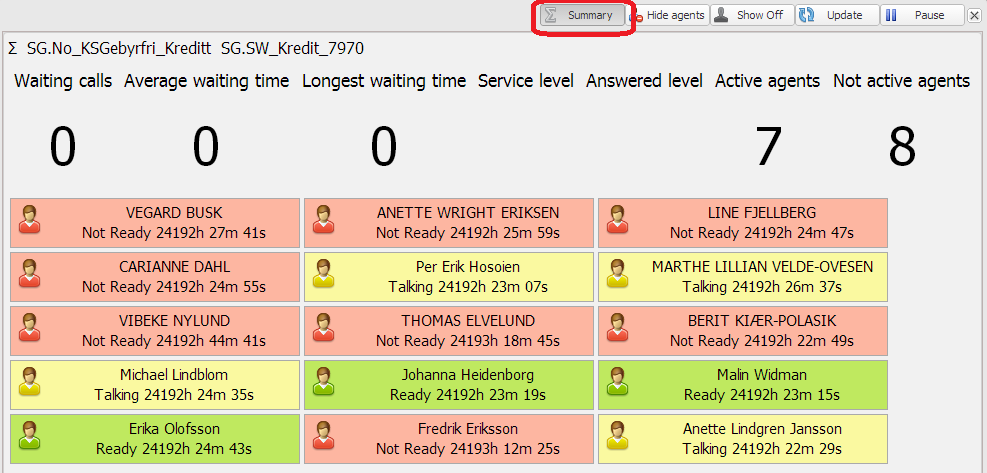
Monitor shows state of the agents members of the current Queue. Green color means state "Ready", red color "Not ready", yellow - "Talking", all other states are shown in orange color. Time shows how much time agent spend in this state.

Only active agents are shown by default. Use [Show off] button to show all agents.
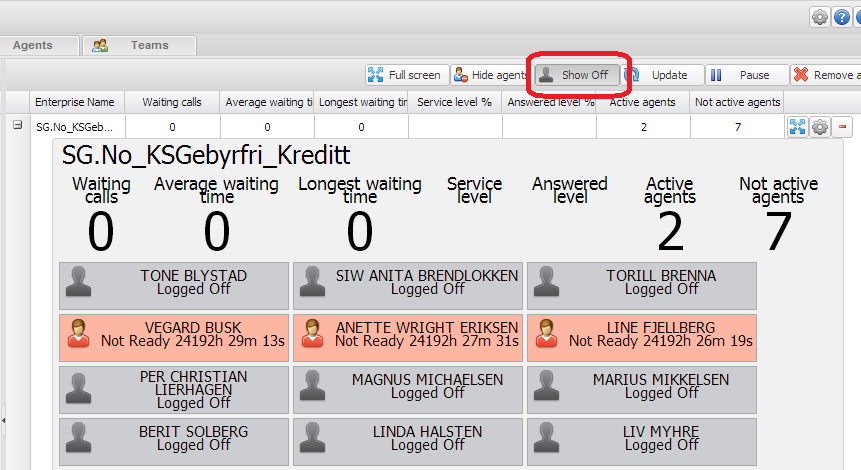
Use [Hide agents] button to hide all agents.
3. Queue reports
Skill Group report shows Sill Group (queue) statistics for a day, week or month. Days reports are splitted in half-hour intervals.
The following data is avaialable:
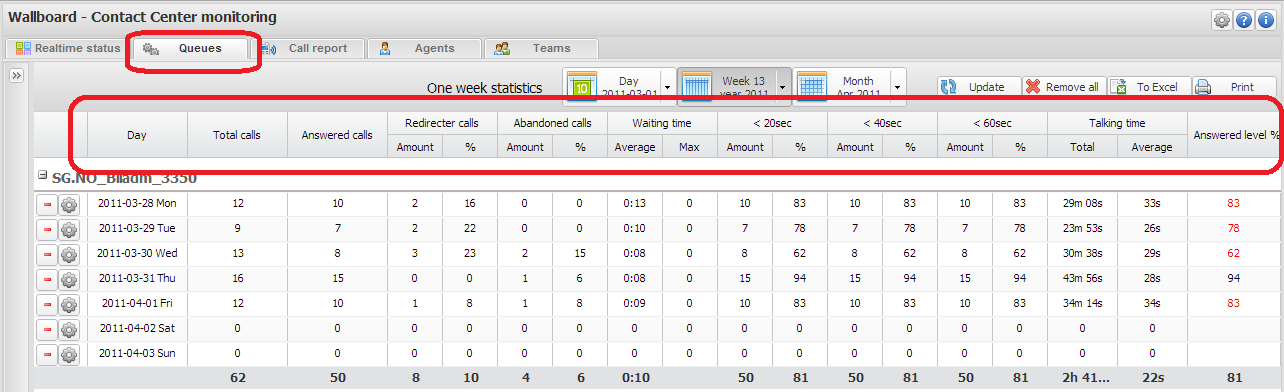
- Time - time interval for the data. Available for daily reports only.
- Total calls - total number of calls in the given period.
- Answered calls - number of answered calls.
- Anbandoned calls amount and % - number of abandoned calls. Short calls that were abandoned within service level (5 seconds normally) are counted too.
- Waiting time (mm:ss) average and max - waiting time for all calls for the given Queue.
- <20sec <30sec <40sec <60sec amount and % - number of calls answered within 20, 30, 40 and 60 seconds.
- Talking time total and average - time spend in talking state of agents members of this group. Average = Total_talking_Time / Total_Answered_Calls within the given time interval.
- Answered level % - relation between answered calls and total number of calls. The following formula is in use: Answered_level_% = (Total_Calls - Abandoned_Calls_In_Service_Level_5sec)*100% / Abandoned_Calls.
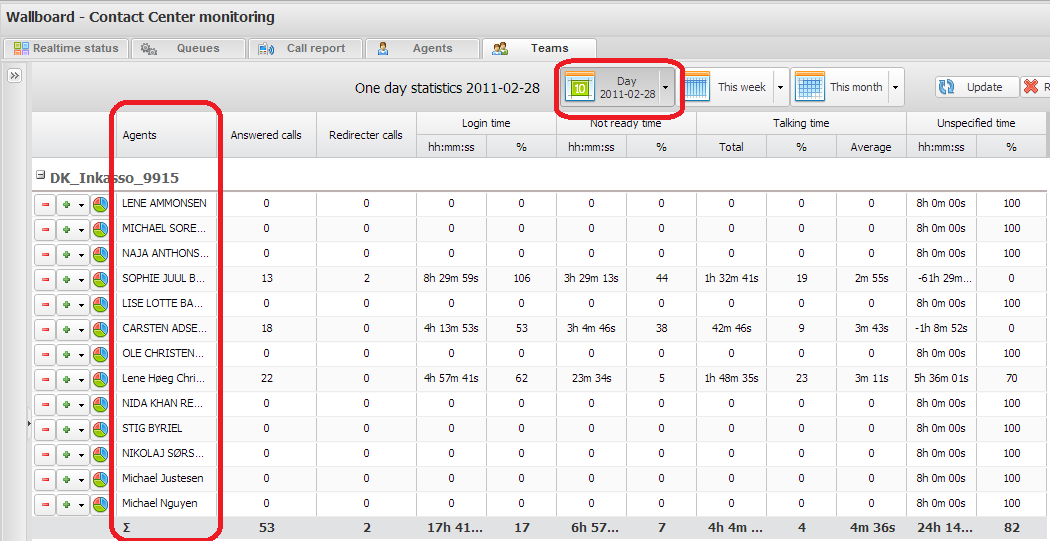
4. Agent reports 
Agent report shows agent's statistic for a day, week or month. Days reports are splitted in half-hour intervals.
The following data is avaialable at Agent report:
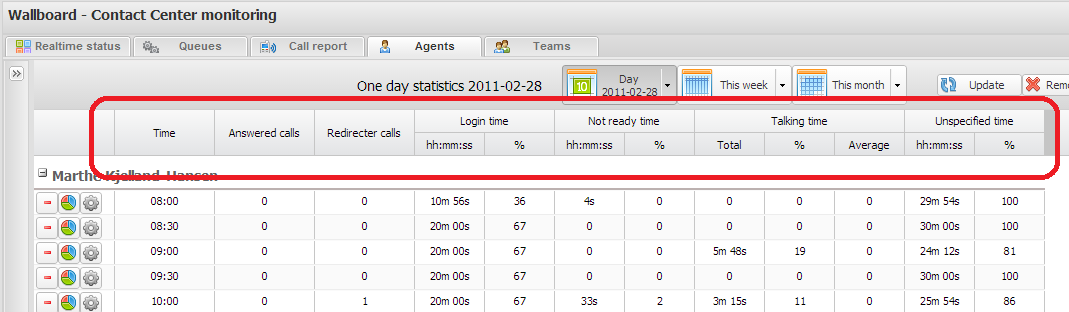
- Time - time interval for the data. Available for daily reports only.
- Answered calls - number of calls answered by an agent.
- Redirected calls - number of calls that were redirected on failure on answer.
- Login time - time agent spend in active state.
- Not ready time - time agent spend in not ready and offline states.
- Talking time - time agent spend in talking state.
- Unspicified time - time agent spend in not specified state. Not talking state and not other registered agents states.
5. Team reports
Team report shows team's statistic for a day, week or month. Days reports are splitted by agent members.
The following data is avaialable at Team report:
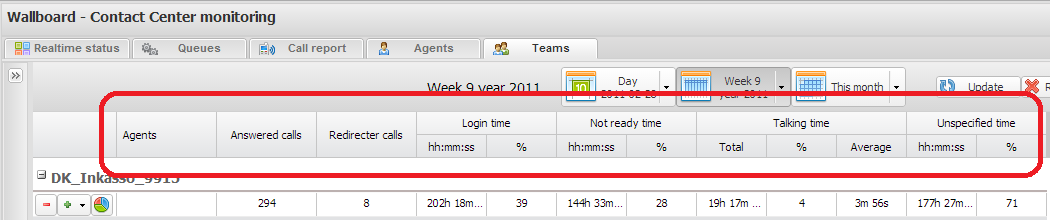
- Enterprise name - name of the team.
- Time - time interval for the data. Available for daily reports only.
- Answered calls - number of calls answered by an agent.
- Redirected calls - number of calls that were redirected on failure on answer.
- Login time - time agent spend in active state.
- Not ready time - time agent spend in not ready and offline states.
- Talking time - time agent spend in talking state.
- Unspicified time - time agent spend in not specified state. Not talking state and not other registered agents states.
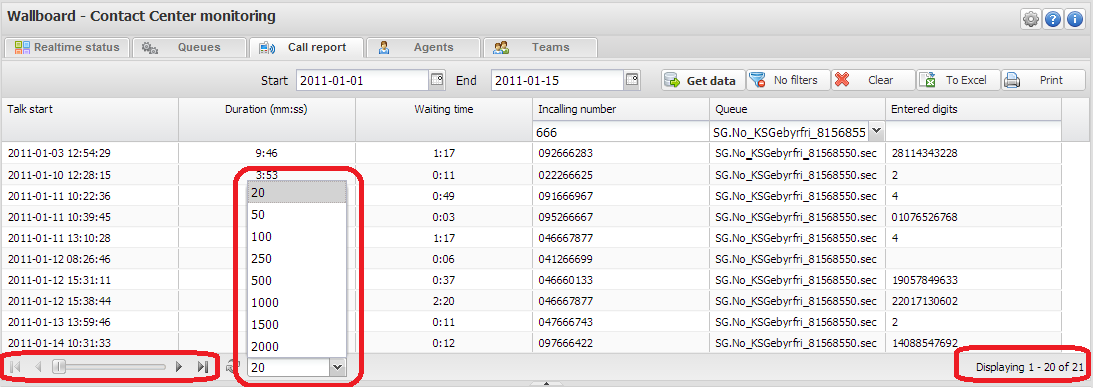
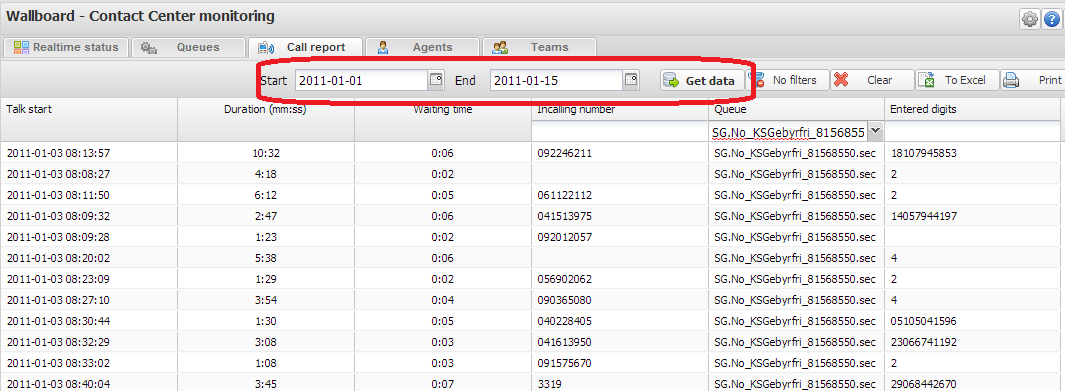
6. Call (IVR) reports
Call report shows incoming calls statistic for the given period. Choose dates and press [Get data] button to retrive data. This can take some time since this report is quite heavy for database.
Calls report can be filtered by incalling number and associated scill group (queue). To remove filter use individal [x] buttons in filters fields or use [No filters] button to remove all fitlers.
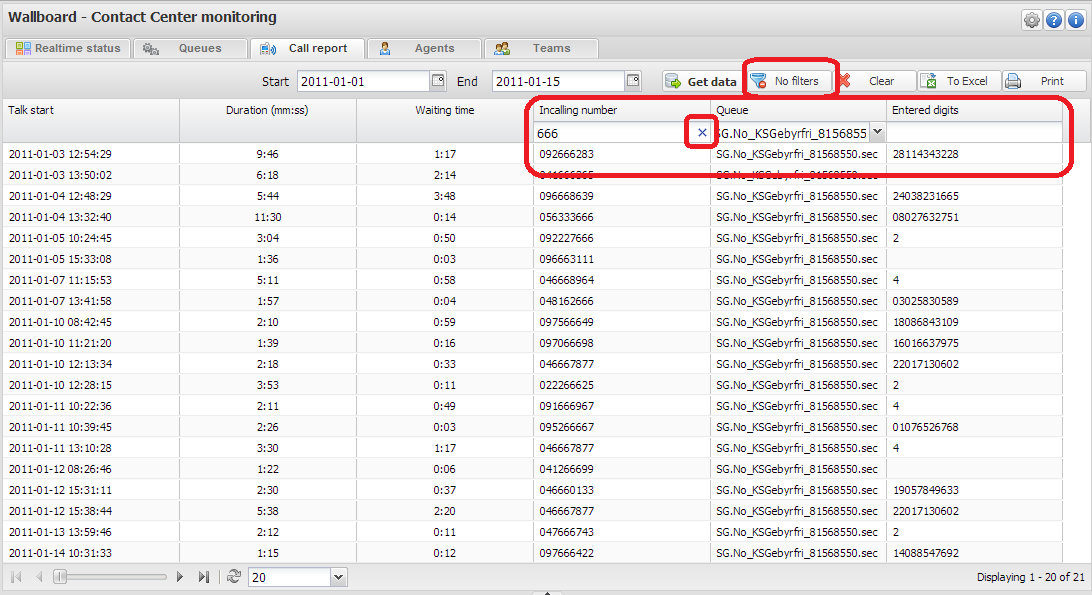
Calls report uses paging. It can be many thousands of calls in the given period. Paging helps to show all those calls page by page. The number of rows per page can be changed. Export to Excel and print works page by page. It is not possible for technical reasons to export to Excel or print all pages at once.